We've got a cheap monitored alarm at home, similar to what you get if you search for "GSM alarm" on AliExpress or eBay. It's got two wireless PIR sensors, and a few door/window sensors.
I had a project in mind that required listening in on the PIR sensors to detect when they saw movement. I'd got a shiny new RTL-SDR dongle, and a small amount of investigation demonstrated that the PIR sensors used On/Off keying (OOK) at 433MHz. But how to decode their transmissions?
On/Off keying is a simple scheme where either you transmit a carrier, or don't. Amplitude modulation with two amplitudes, one of which is zero. It's easy to see as a stream of binary pulses.
I bought a small pile of 433MHz OOK recievers and transmitters. I settled on the SYN470R receiver as various blog posts / etc suggested it had the best performance.
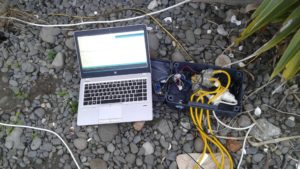
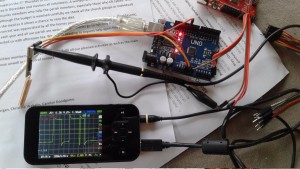 In my fabulous garage full of junk, hidden away in a component drawer, I found my old DSO Nano. I rigged this up to the SYN470R, and could see a stream of binary pulses. Unfortunately, they were very noisy. It turns out the 433MHz OOK receivers have an automatic gain control (AGC) so when nothing is transmitting, the gain gets turned up and you see lots of noise.
I was looking for a nice regularly clocked signal. How would I find it?
I wrote a dumb arduino app to measure each pulse, and dump this out the serial port. It produced a series of lines with the length of each mark and space in microseconds. I wrote a python app to analyse this and look for sequences of pulses where the mark and space widths tended to be from a small set of widths.
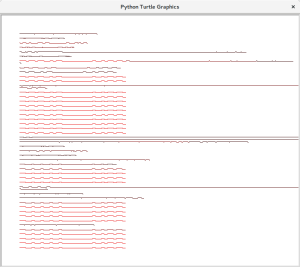 I have never had to write a graphical python app before. I looked at the documentation and decided that if the only graphics library that let me easily draw a few lines was "turtle graphics", that's what I'd use.
It worked! I could see some clear, repeated sequences of pulses. But Turtle Graphics failed me at this point: there was no way to let me detect the mouse was over a pulse train and display some information about it.
At this point I remembered that Linux had a graphics library, aimed at games, called SDL, and this would probably do what I wanted: drawline, fillrect, where is the mouse?
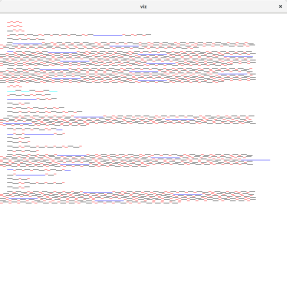 I rewrote the analysis-display app to use pysdl2. The mouseover code wrote a set of pulse lengths to standard output. Eyeballing this showed that the pulses were all (approximately) a multiple of 400µs. Having discovered that the pulses were all a multiple of 400µs long, wrote a discriminator function that would tell me if a pulse looked like a multiple of 400µs, and showed sets of 5 or more pulses that the discriminator said had signal. The mouseover code was rewritten to display the pulses as "number of 400µs units high" and "number of 400µs units low".
I quickly saw the pattern: 4000µs (10 units) low, then 36 1200µs (3 unit) symbols, which were either low for 400µs and high for 800µs (I've guessed this is a "1"), or low for 800µs and high for 400µs (a 0?). In other words, signal is low for 400µs, either low or high for 400µs, then high for 400µs. I modified the visualisation program to decode these pulses, and this is what my sensors send:
Sensor 1: 011110111101001111010000101110110000
Sensor 2: 011110111100110111110000101110111101
This is not the end. The sensors don't just send "I see you" events. They can also send tamper-detect events, and either low battery events or general keepalive events. Now that I've got a signal detection function that doesn't take masses of CPU time, I can put the receiver in a cupboard and run it for 24 hours to see what other signals are around. To capture tamper-detect, I have to do this while everyone's out. My two year old son does not like the sound of the alarm going off.
Some of you will read this and say "Why don't you try the RC-Switch library?" Part way through, I thought "I'll try RC-Switch" but it doesn't decode the signals from my alarm's PIR sensors. It does decode the signal from another cheap PIR sensor I bought off eBay, though. I intend to roll my decode login into RC-Switch and submit a pull request soon.
 In my fabulous garage full of junk, hidden away in a component drawer, I found my old DSO Nano. I rigged this up to the SYN470R, and could see a stream of binary pulses. Unfortunately, they were very noisy. It turns out the 433MHz OOK receivers have an automatic gain control (AGC) so when nothing is transmitting, the gain gets turned up and you see lots of noise.

